Eight games, every box score. Week 0 is small enough that there is no excuse for skipping any of it, so here is what was real, what was noise, and what carries into Week 1.
We said every play gets graded and every result stays up, so here is Week 0. All of it.
The card went 1-2, down 0.56 units.
One winner that still needs a harder look, one of the worst beats I have taken in five years, and one parlay we simply got wrong.
Every game is laid out the same way so we can compare what the market wanted against how the game was actually played underneath the final score.
The Week 0 Card
| Play | Odds | Risk | Result | Units |
|---|---|---|---|---|
| SJSU/USC Over 60.5 | -126 | 1.89u | Win, 68 points | +1.50u |
| Hawaii +4 | -110 | 1.10u | Loss, Stanford 37-27 | -1.10u |
| TCU ML + UNLV ML | +104 | 0.96u | Loss, both legs | -0.96u |
The Whole Slate on One Screen
All eight games on one board. This is the table I want in front of me when we start pricing the next week.
| Game | Close | Final | ATS Winner | ATS Margin | Cover Box Score | YPP Edge | Net Pass Edge | Pts/Play Edge |
|---|---|---|---|---|---|---|---|---|
| SJSU at USC | USC -37.5 | 26-42 | SJSU | +21.5 | Weak | -0.64 | -1.41 | -0.089 |
| North Carolina at TCU | TCU -7.5 | 15-10 | UNC | +12.5 | Strong | +1.69 | +2.50 | +0.122 |
| NC State at Virginia | Virginia -4 | 8-34 | Virginia | +22.0 | Strong | +2.78 | +9.29 | +0.343 |
| Jacksonville State at NDSU | NDSU -6.5 | 7-33 | NDSU | +19.5 | Strong | +2.42 | +3.16 | +0.363 |
| Sacramento State at EMU | EMU -9.5 | 17-28 | EMU | +1.5 | Strong | +0.86 | +2.36 | +0.142 |
| Hawaii at Stanford | Stanford -4.5 | 27-37 | Stanford | +5.5 | Strong | +2.45 | +4.23 | +0.156 |
| New Mexico State at FSU | FSU -31.5 | 17-34 | NMSU | +14.5 | Weak | -1.51 | -1.12 | -0.257 |
| Memphis at UNLV | UNLV -4.5 | 27-21 | Memphis | +10.5 | Strong | +1.14 | +2.46 | +0.184 |
How to read the board
The Cover Box Score column grades the team in the ATS Winner column, not the game winner. SJSU lost 26-42 but covered +37.5, so the grade is SJSU's.
Strong box score means the team that covered also won the underlying efficiency battle. The cover was supported by how they played, which gives it a better chance of carrying forward.
Weak box score means a team covered while losing the underlying efficiency battle. That does not make the cover meaningless. It usually tells us the number did more of the work than the performance did.
Net passing YPA charges sack yardage to the passing game because a sack is a failed passing play. Sack adjusted rushing YPA puts that yardage back where it belongs so a buried quarterback does not make the run game look worse than it was.
ATS margin is measured off the closing number, not the opener.
The team moves below are provisional and capped.
1. San Jose State 26, USC 42
Close: USC -37.5, total 61.5. Our play was Over 60.5 at -126, and it cashed with 68 points.
| San Jose State | USC | |
|---|---|---|
| Total yards | 336 | 505 |
| Plays | 56 | 76 |
| Yards/play | 6.00 | 6.65 |
| Net passing YPA | 7.06 | 8.47 |
| Sack adjusted rushing YPA | 4.48 | 4.82 |
| First downs/play | .321 | .382 |
| Points/play | .464 | .553 |
| Turnovers | 0 | 1 |
| Return yards | 27 | 125 |
| Third downs | 5-11 | 9-13 |
| Penalty yards | 15 | 34 |
| Possession | 22:45 | 37:15 |
| Rating move (provisional) | +1.290 | -1.290 |
USC was good.
505 yards, 6.65 a play, 9 of 13 on third down, and Jayden Maiava finished 25 of 29 for 286 and two touchdowns.
That is a good offensive performance. It was nowhere near dominant enough to justify laying almost 38 when the defense was giving San Jose State room to score.
San Jose State averaged 6.00 a play and 7.06 net passing yards an attempt with no turnovers. Luke Weaver went 21 of 32 for 234 and two scores, and he also led the Spartans with 42 rushing yards.
The biggest part of this game for our bet was Weaver in the second half.
We 100% do not get this over unless he plays the way he did after halftime.
Some of it came against USC backups and that matters. But he still had to make the plays, and he did. The play calling was sharp, San Jose State stayed aggressive, and they executed.
This was not USC sitting back and letting them pick up meaningless yards underneath. The Spartans kept attacking and Weaver started throwing with confidence.
That second half completely changed the shape of our bet. We came in expecting USC to do most of the work on the total.
San Jose State ended up being the reason we got it home.
San Jose State scored 26 on 56 plays with no turnover help. USC also had a 98 yard edge in return yards, which helped keep San Jose State dealing with worse field position.
So we won and I still do not love the handicap.
We projected USC into the 50s doing most of the scoring. Instead USC scored 42 and San Jose State supplied 26.
Getting 60.5 instead of chasing 61.5 was good.
Weaver's second half was better.
2. North Carolina 15, TCU 10
Close: TCU -7.5, total 46.5. TCU moneyline was one leg of our losing parlay. North Carolina won outright and the game finished 21.5 points under the total.
| North Carolina | TCU | |
|---|---|---|
| Total yards | 322 | 281 |
| Plays | 57 | 71 |
| Yards/play | 5.65 | 3.96 |
| Net passing YPA | 6.90 | 4.40 |
| Sack adjusted rushing YPA | 4.15 | 3.53 |
| First downs/play | .351 | .239 |
| Points/play | .263 | .141 |
| Turnovers | 2 | 1 |
| Return yards | 24 | 38 |
| Third downs | 3-11 | 7-16 |
| Penalty yards | 20 | 89 |
| Possession | 26:58 | 33:02 |
| Rating move (provisional) | +1.875 | -1.875 |
Was this a fluke?
No.
I wish it was, because we bet the other side.
North Carolina gained 41 more yards on 14 fewer plays. That one stat tells you most of it.
They won yards per play by 1.69 and net passing by 2.50, and they did it while losing the turnover battle 2-1.
Billy Edwards Jr. went 16 of 28 for 232.
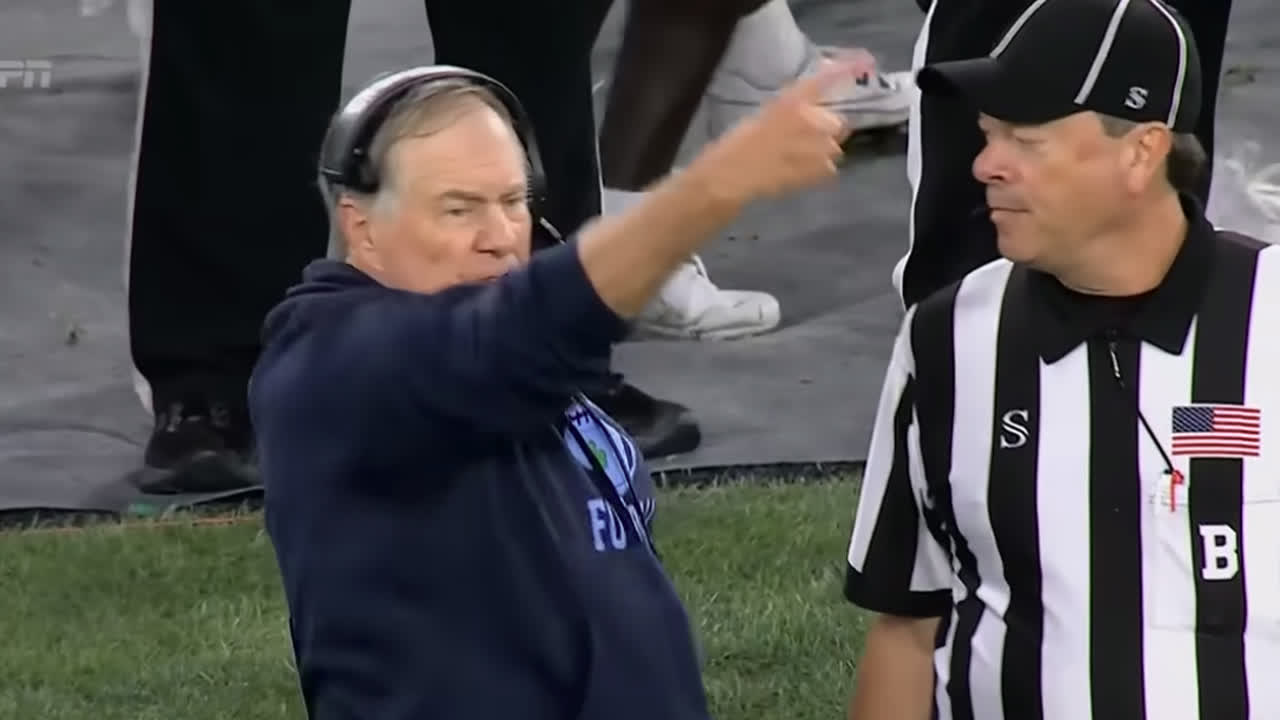
Bill Belichick and a staff everybody spent August questioning got the better of Sonny Dykes in Game 1.
TCU had volume without efficiency.
Jeremy Payne ran 25 times for 142, but the offense still managed only 281 yards and ten points on 71 snaps. TCU also had 89 penalty yards to North Carolina's 20.
We heard a lot about Harvard transfer Jaden Craig all spring. He supposedly had complete control of the offense, and Sonny Dykes talked about how rarely he had turned the ball over since arriving at TCU.
His first game did not look anything like the version we heard about all offseason.
Craig finished with 175 passing yards and no touchdowns, and TCU averaged only 4.40 net passing yards an attempt.
Late in the game he also had room to use his legs for a crucial first down, pulled up and threw the ball away instead, and TCU's last real chance was basically gone.
What worked for Craig at Harvard did not translate in his first game against this level of defense.
Craig was bad, the offensive line did him no favors, and every bit of the hype from March through August disappeared on Saturday.
Seventy one snaps.
Ten points.
Our mistake is the one that bothers me most.
We had already passed on TCU because the spread was too expensive, then used the moneyline like it was a different opinion.
It was not.
If a favorite is too expensive against the spread, the moneyline needs its own fair probability and its own reason to be played.
We never built that case.
TCU is off in Week 1, so nothing to chase.
The downgrade sits there until September 12.
3. NC State 8, Virginia 34
Close: Virginia -4, total 50.5. We passed it, and Virginia -4 is one we should have had.
| NC State | Virginia | |
|---|---|---|
| Total yards | 168 | 413 |
| Plays | 51 | 68 |
| Yards/play | 3.29 | 6.07 |
| Net passing YPA | 2.79 | 12.08 |
| Sack adjusted rushing YPA | 3.96 | 4.79 |
| First downs/play | .196 | .265 |
| Points/play | .157 | .500 |
| Turnovers | 2 | 0 |
| Return yards | 86 | 0 |
| Third downs | 4-13 | 3-14 |
| Penalty yards | 13 | 51 |
| Possession | 21:57 | 38:03 |
| Rating move (one game cap) | -2.000 | +2.000 |
Biggest mismatch on the slate and it was not close.
Virginia gained 245 more yards and had the ball 16 minutes longer.
Tony Elliott went 11-23 over his first three seasons at Virginia.
The Cavaliers are now 12-3 over their last 15 games.
At some point the market has to acknowledge that this is not the same program.
The passing gap is ridiculous.
Virginia at 12.08 net yards an attempt.
NC State at 2.79.
That is not a competitive football game.
Beau Pribula went 9 of 11 for 155 and two scores and added 110 on the ground. He never needed volume because Virginia was controlling everything.
Virginia did not need to grind out long touchdown drives.
Pribula hit touchdown passes of 45 and 47 yards, and the Cavaliers controlled the game around those explosives with more than 38 minutes of possession.
NC State also had an 86 to 0 edge in return yards and did nothing with it.
The conclusion is not that Virginia was perfect.
It is that NC State had no answers.
We liked Virginia before kickoff. We just never turned that into an actual bet on Virginia -4, so it never made the card.
That is our process failing, not hindsight, and it is fixed.
Biggest upgrade on the board.
Still not a reason to blindly chase their next number.
4. Jacksonville State 7, North Dakota State 33
Close: NDSU -6.5, total 46.5. We passed the under. It finished at 40.
| Jacksonville State | North Dakota State | |
|---|---|---|
| Total yards | 170 | 373 |
| Plays | 54 | 67 |
| Yards/play | 3.15 | 5.57 |
| Net passing YPA | 2.96 | 6.12 |
| Sack adjusted rushing YPA | 3.32 | 5.24 |
| First downs/play | .259 | .299 |
| Points/play | .130 | .493 |
| Turnovers | 2 | 1 |
| Return yards | 33 | 35 |
| Third downs | 2-10 | 5-14 |
| Penalty yards | 76 | 94 |
| Possession | 23:53 | 36:07 |
| Rating move (one game cap) | -2.000 | +2.000 |
North Dakota State did not sneak up on an FBS team.
They took them apart.
203 yard edge in total offense, 2.42 in yards per play, and more than 36 minutes of the football.
Jacksonville State finished with 170 yards and seven points.
The balance was the story.
Nathan Hayes went 14 of 22 for 160 and two scores, Myles Mitchell ran for 74, and Jacksonville State could not sell out on one phase because NDSU could beat them either way.
The under stayed off our card because the pregame evidence was not clean enough.
Finishing under does not turn it into a bet we should have made.
The bigger takeaway was the side.
Finishing 33-7 does not mean we should retroactively turn NDSU -6.5 into a play either.
It does change how we price them going forward.
Stop pricing North Dakota State with an FCS discount.
They are in the FBS now, and Week 0 looked nothing like a transition year.
5. Sacramento State 17, Eastern Michigan 28
Close: EMU -9.5, total 52.5. We passed the over after the number moved through our price. Final was 45.
| Sacramento State | Eastern Michigan | |
|---|---|---|
| Total yards | 268 | 348 |
| Plays | 63 | 68 |
| Yards/play | 4.25 | 5.12 |
| Net passing YPA | 4.29 | 6.65 |
| Sack adjusted rushing YPA | 4.13 | 2.93 |
| First downs/play | .206 | .309 |
| Points/play | .270 | .412 |
| Turnovers | 2 | 1 |
| Return yards | 35 | 90 |
| Third downs | 3-14 | 5-15 |
| Penalty yards | 85 | 29 |
| Possession | 27:32 | 32:28 |
| Rating move (provisional) | -0.225 | +0.225 |
Eastern Michigan deserved the cover.
This was not the kind of result that deserves some massive upgrade.
The Eagles won yards per play 5.12 to 4.25 and net passing 6.65 to 4.29. They also committed one fewer turnover, had 56 fewer penalty yards and owned a 55 yard edge in the return game.
That is a lot of small advantages adding up.
The interesting part is the run game.
Sacramento State was actually better there, 4.13 to 2.93 in sack adjusted rushing yards per attempt.
Eastern Michigan did not physically overwhelm them.
They threw it better, made fewer mistakes and created more hidden yards.
That is enough to explain the cover.
It is not enough to make me suddenly price Eastern Michigan several points higher.
And the over staying off the card was the right process.
We passed once 52.5 moved through our number.
It finished 45, but the final score is not what made the pass right.
The price did.
6. Hawaii 27, Stanford 37
Close: Stanford -4.5, total 48.5. We had Hawaii +4 at -110.
| Hawaii | Stanford | |
|---|---|---|
| Total yards | 322 | 483 |
| Plays | 74 | 71 |
| Yards/play | 4.35 | 6.80 |
| Net passing YPA | 4.89 | 9.12 |
| Sack adjusted rushing YPA | 2.90 | 4.68 |
| First downs/play | .243 | .296 |
| Points/play | .365 | .521 |
| Turnovers | 1 | 0 |
| Return yards | 14 | 121 |
| Third downs | 7-17 | 7-15 |
| Penalty yards | 31 | 62 |
| Possession | 28:56 | 30:54 |
| Rating move (provisional) | -0.825 | +0.825 |
This one got so long it became its own post.
Two replay decisions went Stanford's way, we were winning the game outright with four minutes left, and it ended on a fumble return with 1:12 on the clock.
Then Hawaii never sent Alejado back out, which I still cannot explain.
For the purposes of this review, Stanford outgained them by 161 yards and won net passing 9.12 to 4.89.
Hawaii managed only 46 rushing yards, which left Alejado carrying basically the entire offense with 50 pass attempts.
Stanford deserved the better team grade.
The final 10 point margin just makes the game look a hell of a lot more comfortable than it actually was.
Hawaii stays capped until they can run it.
Stanford gets an upgrade, but Miami is a completely different test.
7. New Mexico State 17, Florida State 34
Close: FSU -31.5, total 53.5. We liked New Mexico State +31.5 before kickoff and never got it onto the card.
| New Mexico State | Florida State | |
|---|---|---|
| Total yards | 319 | 419 |
| Plays | 66 | 66 |
| Yards/play | 4.83 | 6.35 |
| Net passing YPA | 5.78 | 6.89 |
| Sack adjusted rushing YPA | 2.81 | 5.95 |
| First downs/play | .273 | .303 |
| Points/play | .258 | .515 |
| Turnovers | 1 | 1 |
| Return yards | 16 | 95 |
| Third downs | 10-17 | 8-14 |
| Penalty yards | 53 | 85 |
| Possession | 28:28 | 31:22 |
| Rating move (provisional) | +0.810 | -0.810 |
Florida State was clearly better.
Nothing in this box score looked like a team that should have been laying more than 30.
Exactly 100 more yards on exactly the same 66 plays, with a massive edge running it.
The Seminoles averaged 5.95 adjusted yards a carry to New Mexico State's 2.81.
New Mexico State had to throw to stay in it and did a decent job.
Trey Hedden went 26 of 42 for 272 and two scores, and the Aggies converted 10 of 17 third downs.
That is how you hang around inside a number that big.
Keeping the over off the card was fine too.
We never had enough to force it at 53.5, and it happened to finish at 51.
The +31.5 was the same process problem as Virginia.
We liked the side and never got the number written down as an actual bet.
SMU is a real test next.
This box score makes that game more interesting than a routine 34-17 final would make it look.
8. Memphis 27, UNLV 21
Close: UNLV -4.5, total 55.5. UNLV moneyline was the other leg of our parlay. Memphis won outright.
| Memphis | UNLV | |
|---|---|---|
| Total yards | 418 | 460 |
| Plays | 60 | 79 |
| Yards/play | 6.97 | 5.82 |
| Net passing YPA | 8.00 | 5.55 |
| Sack adjusted rushing YPA | 6.12 | 6.17 |
| First downs/play | .333 | .291 |
| Points/play | .450 | .266 |
| Turnovers | 1 | 0 |
| Return yards | 72 | 16 |
| Third downs | 3-11 | 3-15 |
| Penalty yards | 70 | 75 |
| Possession | 24:51 | 35:09 |
| Rating move (provisional) | +1.575 | -1.575 |
UNLV won total yards 460 to 418.
If you stop there you get the same wrong answer we did.
It took UNLV 79 plays to get 460.
Memphis needed 60 to get 418.
The Tigers won yards per play by 1.14 and points per play by .184 while losing the turnover battle and holding the ball for only 24:51.
Now look at the adjusted rushing numbers.
Memphis 6.12.
UNLV 6.17.
Basically identical.
The cleanest separator was protection.
Jackson Arnold went 25 of 37 for 291 and two touchdowns, which looks great on the surface, but he was sacked six times.
Memphis allowed one sack all night.
Charge the sack yardage where it belongs and UNLV's 7.66 raw passing YPA falls to 5.55 net while Memphis sits at 8.00.
Those six sacks were not a footnote.
They are a big reason UNLV went 3 of 15 on third down.
This was the worst decision on the entire card because the warning signs were there before kickoff and we talked ourselves out of them.
We got caught up in the Memphis roster turnover story.
The story sounded good.
The matchup evidence was better.
And we picked the story.
Our own process had already blocked Memphis over the quarterback situation.
Fine.
The rule can stay.
But a rule keeping us off Memphis was not permission to turn around and bet UNLV.
There is no version of that I can defend.
Memphis showed efficient quarterback play, a real run game and a defensive front that wrecked passing downs.
That profile travels, and the cheap version of Memphis might already be gone.
What the Passes and Misses Actually Were
Results do not determine whether a pass was right.
The evidence and the price at the time do.
Good passes: Sacramento State and Eastern Michigan over moved through our price and closed 52.5. Hawaii and Stanford under lost support when new information weakened the older case. Florida State over never gave us enough at 53.5. We had also already passed the TCU spread because the number was too expensive.
All four happened to lose.
That is not why I am calling them good passes.
Each one failed either our price or evidence requirement before kickoff.
The outcomes just happened to punish the side we stayed away from.
Nobody talks about the bets they did not make, but that is part of the process too.
Blocked plays that would have won: TCU and North Carolina under 46.5 finished at 25. Jacksonville State and NDSU under 46.5 finished at 40. Memphis +4.5 won outright.
I can live with the first two.
The entry or the evidence was not clean enough when we had to decide.
Memphis is the one that bothers me, and not because the rule keeping us off it was necessarily wrong.
Taking UNLV on the other side of it was the mistake.
Real process misses: Virginia -4 and New Mexico State +31.5 were the same failure twice.
We liked both sides and neither one ever got written down as a bet at the number we liked.
TCU moneyline was a spread we had already passed on, repackaged as a parlay leg without ever asking whether the moneyline itself had value.
UNLV was worse.
Our own process gave us enough concern about Memphis to stay away from the Tigers, and somehow we turned that into permission to bet the other side.
It was not.
Those were process mistakes, not bad luck.
The Week 1 fix is simple.
Every side we like gets a PLAY or PASS decision at the exact number.
Every parlay leg has to qualify on its own.
The Week 1 Carry Forward Board
Starting points, not bets. The price still decides everything.
| Team | Week 0 Signal | Stance | What Kills It |
|---|---|---|---|
| San Jose State | Efficient passing, cover only weak because USC won the box score | Upgrade the offense, live short dog interest | Market prices Weaver or protection falls apart |
| USC | Efficient, but no margin dominance | Do not pay the blind favorite tax | Defense improves and the price drops enough |
| North Carolina | Outplayed TCU despite losing turnovers | Upgrade, upset was earned | Turnovers continue or run game stalls |
| TCU | 281 yards and 10 points on 71 plays | Downgrade, no forced action | Better number or real QB improvement after the bye |
| Virginia | Biggest efficiency win on the slate | Upgrade, do not chase | Market overreacts to one dominant opener |
| NC State | Worst offensive box score of the week | Fade or wait until the offense functions | Real personnel or scheme improvement |
| North Dakota State | Dominated both phases | Price them like a legitimate FBS team | Market adjusts all at once |
| Jacksonville State | Protection and passing both failed | Downgrade | Matchup lets them lean on the run |
| Eastern Michigan | Passing edge plus hidden yards | Small upgrade only | That 2.93 rushing number gets exposed |
| Sacramento State | Ran it well enough, could not throw | Mild downgrade | QB efficiency actually improves |
| Stanford | Best net passing edge outside Virginia | Upgrade, then price the Miami jump | Miami exposes the Week 0 passing edge as opponent specific |
| Hawaii | Can come back, cannot run | Capped until rushing improves | Healthy line and legitimate early down rushing |
| New Mexico State | More competitive than the huge spread | Small upgrade as a dog profile | Rushing mismatch becomes impossible to hide |
| Florida State | Won the box score, failed against the market | Downgrade against the price | Market corrects and the defense cleans up |
| Memphis | Efficient offense plus disruptive defensive front | Strongest carry forward on the board | Value disappears or QB situation changes |
| UNLV | Volume without passing efficiency, six sacks allowed | Downgrade until protection stabilizes | Protection gets fixed and Arnold can access the downfield passing game |
The Final Grade
One winner.
One brutal beat.
One bad parlay.
Going through all eight games told us a hell of a lot more than the 1-2 record did.
San Jose State's cover graded weak, but the offense was legitimate.
North Carolina's upset was strongly confirmed, and they did it while losing the turnover battle.
Virginia and North Dakota State had the two cleanest domination profiles.
Eastern Michigan earned the cover without earning much of an upgrade.
New Mexico State covered because the number was too big, not because they were the better team.
Memphis produced one of the clearest carry forward profiles on the board, and the worst part is that our pregame evidence leaned that direction before we ended up betting UNLV instead.
TCU and UNLV were not unlucky parlay legs.
They were wrong picks.
There is a difference.
Best of luck this week.